


CHAPTER I
What is Graphic Analysis and Why Does It Matter?

CHAPTER II
Exploring the essential Graphic Patterns

CHAPTER III
How to Apply Graphic Patterns in Different Markets

CHAPTER IV
Complementary Tools and Indicators for Technical Analysis

CHAPTER V
Protecting Your Capital

CHAPTER VI
Trading Psychology: How to Control Your Emotions and Make Smart Decisions

CHAPTER VII
Evaluating Your Performance: How to Measure and Improve Your Trading Strategies

CHAPTER IV
The Beginning of a New Journey in Trading

cHAPTER V
Protecting Your Capital

CHAPTER VI
Trading Psychology: How to Control Your Emotions and Make Smart Decisions

CHAPTER VII
Evaluating Your Performance: How to Measure and Improve Your Trading Strategies

CHAPTER VIII
The Beginning of a New Journey in Trading


"I'm a beginner, I don't know if I'll understand the graphic patterns"
The e-book was developed with a clear and didactic language, ideal for beginners. We start with the basic concepts and gradually move towards the most complex patterns. In addition, the illustrations and practical examples facilitate learning

"I've tried to learn technical analysis before, but I found it very complicated"
Unlike other materials, "Mastering Graphical Patterns" focuses on practical application. We show how to identify, interpret and use patterns in real market situations, making learning easier and more relevant
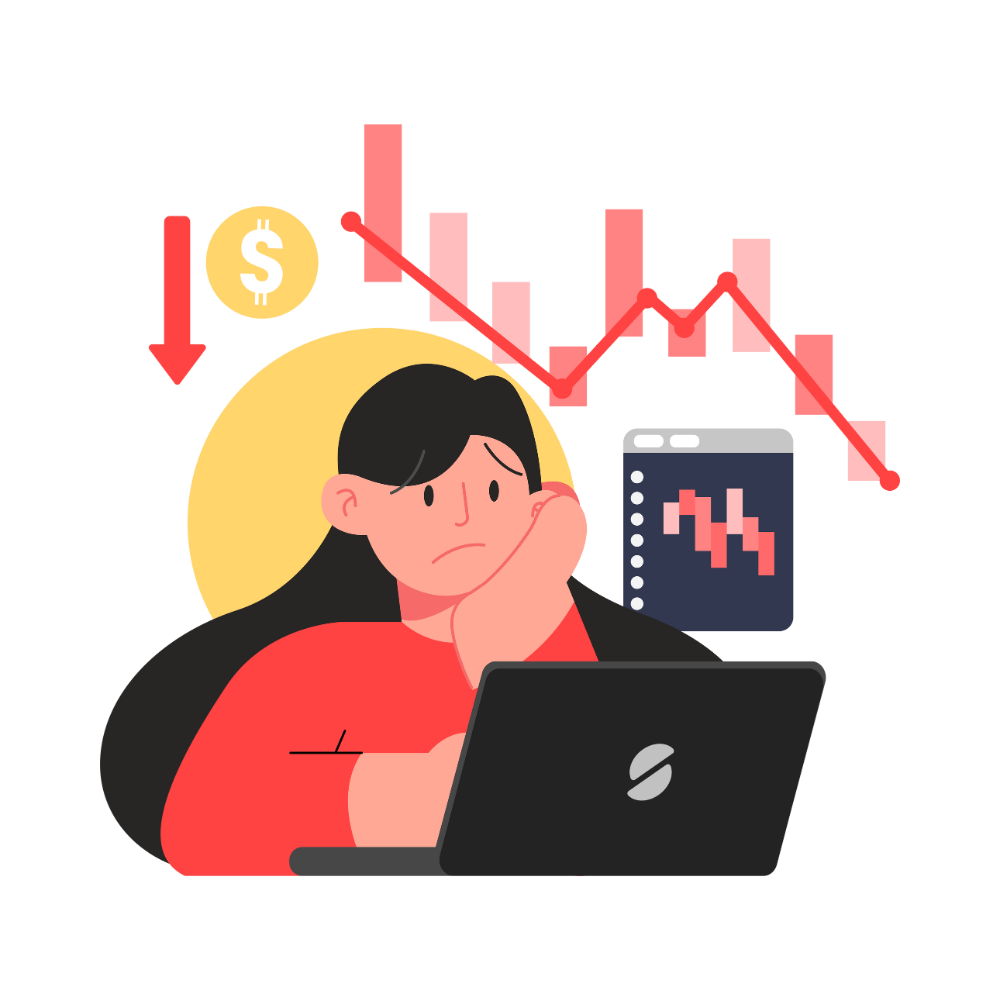
"I've already lost money in the financial market, I'm afraid to invest again"
Risk management is one of the pillars of this e-book. We teach strategies to protect your capital and minimize losses, so that you can operate with more security and confidence

"I don't know if graphic patterns really work"
Graphic pattern analysis is a proven technique used by experienced traders around the world. The e-book presents case studies and practical examples that demonstrate the effectiveness of the standards
"I've been using technical analysis for years. What can this e-book teach me that I don't already know?"
We understand that you already have a solid foundation in technical analysis. However, 'Mastering the Graphic Patterns' offers an in-depth and refined approach, focused on details that many experienced traders neglect
"I don't have time to study technical analysis"
The e-book is direct and objective, with organized content so you can learn at your own pace. In addition, bonuses, such as the quick identification spreadsheet and the pocket guide, optimize your study time

✅ BEGINNERS
who want to learn from scratch and operate more safely

✅ INTERMEDIATE TRADERS
who want to improve their strategies and increase their hit rate

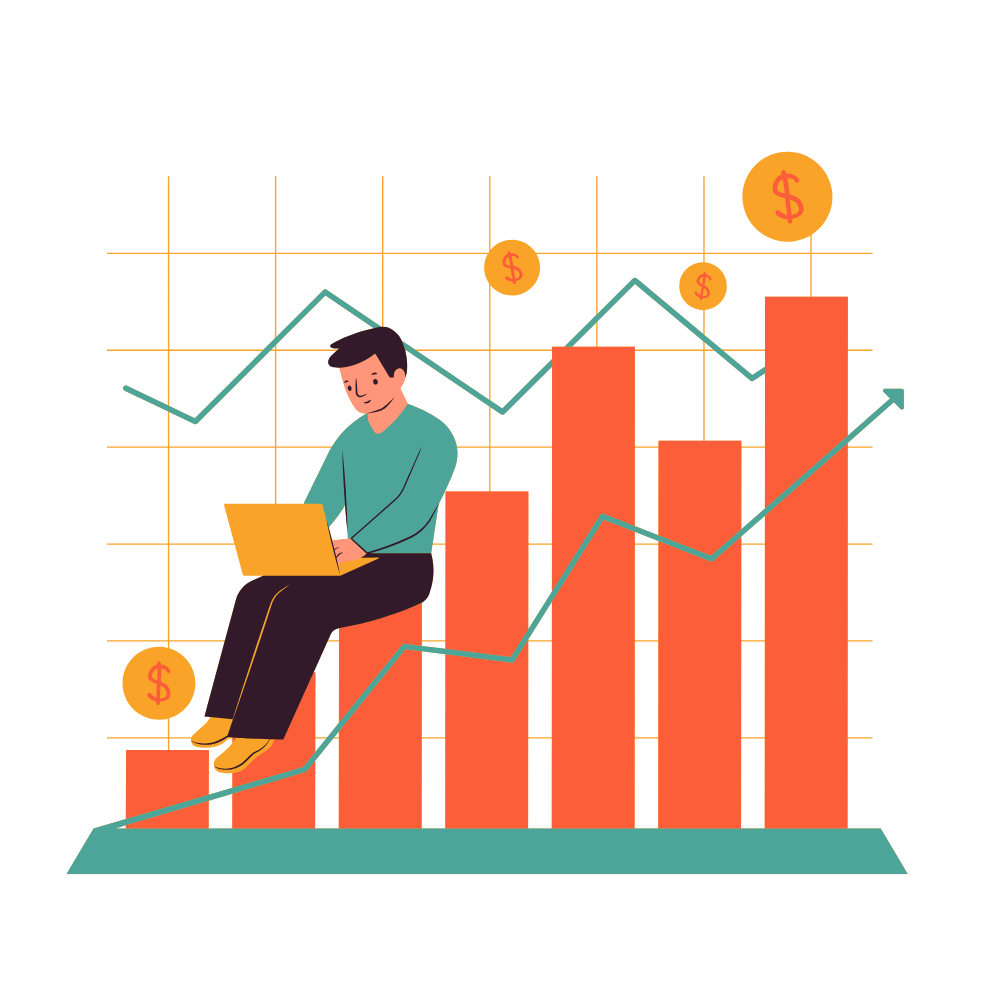
✅ INVESTORS
who are looking to boost their trading success

✅ PEOPLE WHO SEEK FINANCIAL INDEPENDENCE
Anyone looking for new ways to increase their income